Transients and attractors in epidemics
Bauch, Chris T., and David JD Earn. “Transients and attractors in epidemics.” Proceedings of the Royal Society of London B: Biological Sciences 270, no. 1524 (2003): 1573-1578.
Historical records indicate that childhood infections had complex and unique dynamics: outbreaks of some diseases were regular, corresponding to annual and bi-annual peaks, while others were seemingly aperiodic. Spectral density analysis can reveal the most prominent periodicities in the time series to study inter-epidemic periods. The most prominent periodicities commonly correspond to resonant and non-resonant peaks. Resonant peaks usually indicate the dominant periodicities which are usually integer multiples of 1 or 2 years. Non-resonant peaks indicate infrequent cycles which apparently occur at any periodicity. The goal of this study was to explain the incidence patterns of measles in NYC, chickenpox in Manitoba, rubella in Ontario, and whooping cough in London. To do this, they constructed seasonally (i.e., school term time) forced, deterministic SEIR models for each disease and then performed asymptotic model analysis to determine if they could predict resonant and non-resonant peaks.
Before their study, Earn et al. (2000) showed that demographic stochasticity was necessary to explain multiple attractors. Thus, for cities with available time series information on birth rates and vaccination levels, asymptotic analysis could correctly predict resonant peaks. They applied this approach to chickenpox, rubella, and whooping cough. Their chickenpox model correctly indicated that the resonant peak was an annual attractor and that it was infrequent but still possible to switch to other attractors in the presence of noise. In contrast, rubella and whooping cough could not be explained by this asymptotic model analysis approach. They suggested that this failure was related to stochasticity.
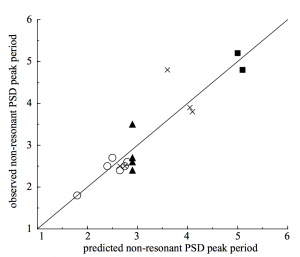
For predicting non-resonant peaks, they analyzed the attractors in the model by applying a linear perturbation technique. To do this, they obtained the model’s associated Poincare map. A Poincare map is a first recurrence map or, in other words, a map of a model’s initial periodic trajectory. With each Poincare map, they numerically calculated its damping rate and oscillation period. Previous studies noted that noise could prevent oscillations at non-resonant peaks from dying out and that the damping rate provides a measure of how sensitive non-resonant peaks are to noise. By combining the asymptotic analysis of the model’s attractors and the perturbation analysis of its associated Poincare map with a relative peak-magnitude analysis of resonant and non-resonant peaks, the authors were able to predict how each disease changed in response to changes in birth rate or vaccination level. Key to this prediction was the time average rate of transmission, <β> which determined the effective transmission rate due to transient dynamics in population size and susceptible replacement.